I often use Twitter as a source of ideas for analysis. Some tweets make me research some topics. Other anger me enough to have a look at the data to get a reality check.
So rainy season in Japan ended last week. Think rain mixed with seasonal depression for 5 weeks, from beginning of June to mid-to-end July. So I understand that people complain it was long.
But after an n-th tweet saying once again this year was the longest, too long, the longest in memory, I started to get tired.
I mean, I use the simple mnemonic above to remember the standard period for the rainy season, based on what I was told when arriving in Japan and my 6 years living here. And this year’s perfectly fit this extremely simple model. So, time to redirect this frustration to have a look at the data.
Looking at the data
Thankfully, it is extremely easy to fine the data. The Japan Meteorological Agency (JMA) publishes the data as a simple table starting from 1951.
The data is clean in itself. There is one missing data point: the end of the rainy season in 1993.
Looking into this issue led to an interesting sidetrack. The rainy season of 1993 was actually extremely long which led to poor rice recolts which in turn let to the so-called Rice Riots.
The JMA initially announced the end of the rainy season but retracted it once they realized it was actually still ongoing. No official date has been published after, leading to this one and only null value.
Given that simple format, loading and formating the data was trivial (using lubridate for date parsing).
First question for me: is my simplistic model correct?
tsuyu %>%
  mutate(
    deb = as_date(paste0("2020-", month(startDate), "-", day(startDate))),
    finS = as_date(paste0("2020-", month(endDate), "-", day(endDate)))
  ) %>%
  summary()
This gives me an average start date on June 8th and end date on July 18th. So it looks like my model, as simple as it is, is actually fairly accurate. More importantly, it is simple to remember and accurate.
So, what about the 2020’s rainy season?
With that simple confirmation out of the way, let’s check for 2020.
With 43 days, this season is in line with the last 68 years of data (mean = 40.6 days, median = 40 days, sd = 10.1 days).
That said, it is easier to understand with a graph:
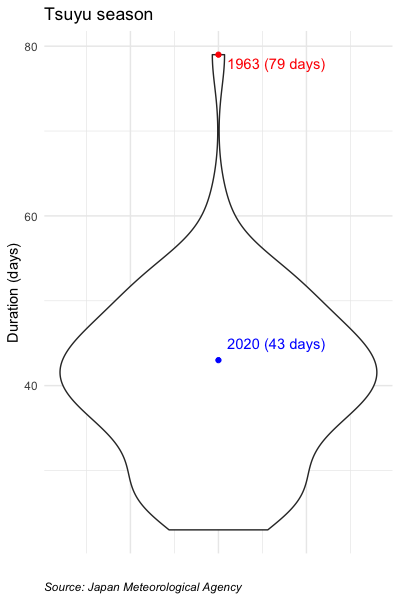
It’s also interesting to see the 1963 outlier. 40 days of rainy season is bad enough, I would not like to have to go through 70 days…